Take the operator's own storm log and ask it a harder question
UTAH · 8 PROGRAMS · 181 GENERATORS · WINTER 2024–25Utah runs the largest remotely controlled seeding network in the United States — expanded in 2023 with $12M one-time funding and a $5M annual budget RECORD — and credits it with 3–15% of winter precipitation CLAIMED. The evaluations behind that number are produced by the contractor that runs the program, using target/control comparisons whose treatment variable is not exogenous: storms are seeded exactly when the wind, moisture and temperature favor the target areas. Which means the seeded storms were going to out-snow the controls anyway, seeding or no seeding.
In 2026 an independent researcher, Bryce Judy, took that selection problem seriously — with nothing but public data. The state's own 2024–25 operations reports supplied 203 seeded storm periods and 17,143 generator-hours RECORD; NOAA HRRR supplied each storm's 700 hPa wind; USDA SNOTEL gauges supplied the snow MEASURED. Every line of code, every dataset and the working paper are published (github.com/bryjudy/seeding-verification). We have reviewed the study, recomputed its storm-level estimates from the released data, and rebuilt its headline design blind from a fresh SNOTEL pull (the verification pass below), and adopted its datasets into the Atlas. This case presents what it found, because the method — not just the Utah answer — is a permanent forensic instrument.
Finding one: the ladder of designs
SAME SEASON · SAME GAUGES · THREE ANSWERSThree evaluation designs were applied to the identical 2024–25 season. The first is how operational programs are actually evaluated: seeded storms versus unseeded storms, with far-away control gauges. It returns +69% pooled — and +335% for the Central/Southern program. The gold-standard SNOWIE field experiment puts orographic seeding at single to low double digits per event, so +335% is physically impossible. It is not a measurement of seeding. It is a direct measurement of how much selection bias a conventional evaluation carries at storm scale MEASURED.
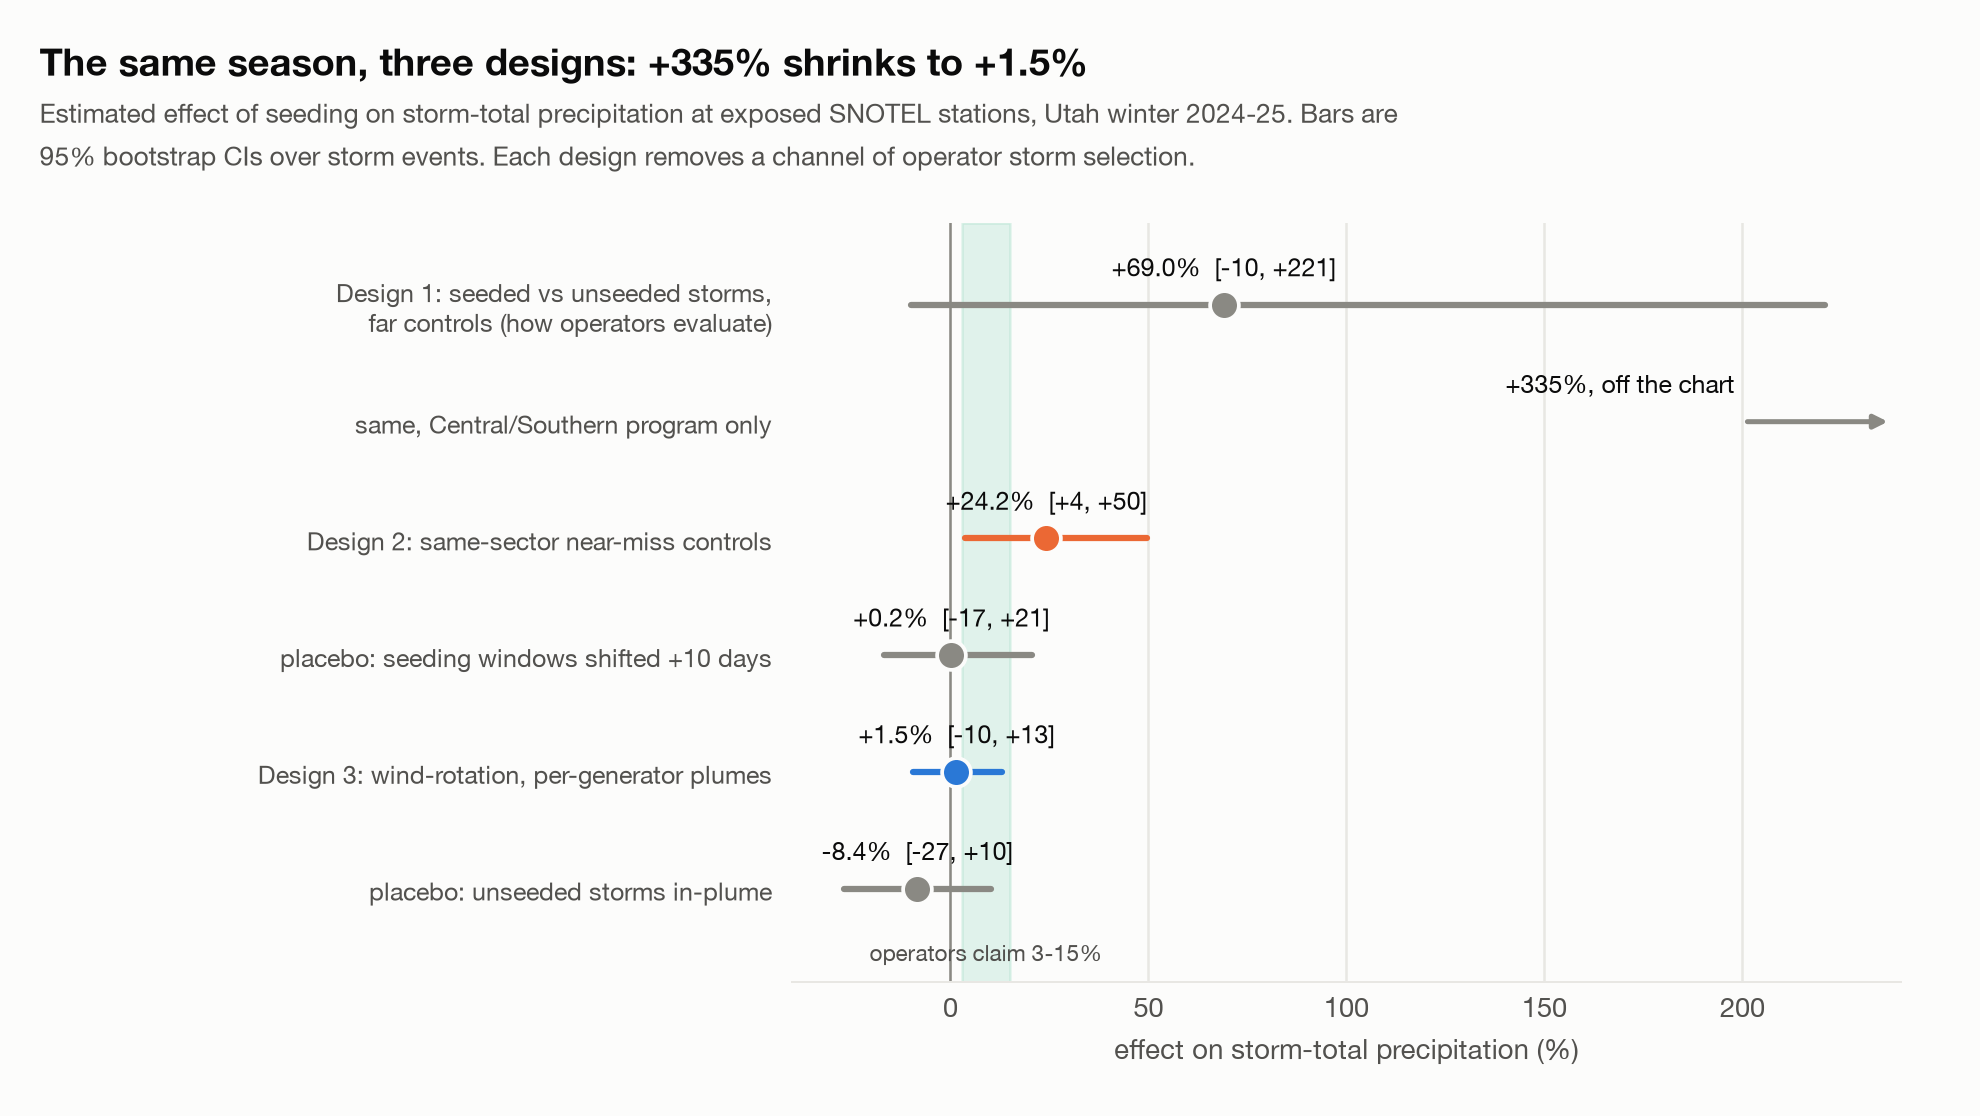
| Design | Effect on storm-total precip | 95% CI |
|---|---|---|
| 1 · Seeded vs unseeded storms, far controls (how programs are evaluated) | +69% pooled; +335% for the largest program | [−9.9, +220.8] |
| 2 · Same-sector near-miss controls | +24.2% | [+3.7, +49.7] |
| placebo: seeding windows shifted +10 days | +0.2% | [−16.7, +20.7] |
| 3 · Wind-rotation, per-generator plume geometry | +1.5% | [−9.6, +13.1] |
| built-in placebo: unseeded storms in-plume | −8.4% | [−26.8, +10.3] |
Each rung down the ladder removes a channel for selection, and each rung the estimate falls. The most selection-robust design lands at +1.5% per seeded storm with a clean placebo: consistent with the physical literature, consistent with zero, and excluding per-storm effects above roughly 15–20%. One season cannot separate "works as claimed" from "does nothing" — four to nine seasons of operations records would.
The wind-rotation idea
WHY DESIGN 3 RESISTS THE SELECTION THAT INFLATES 1 AND 2Silver iodide plumes travel downwind, so which gauges are exposed changes storm by storm with each storm's own wind. Design 3 calls a station in-plume for an event if some generator lies 5–45 km upwind within ±40° of that event's HRRR 700 hPa wind, then estimates the in-plume premium during seeded events against station and event fixed effects — with the same premium during unseeded events as a built-in placebo that must be zero, because no silver iodide was released. Operators choose when to seed, but they cannot rotate a precipitation enhancement around their generators in step with the wind. That placebo came back at −8.4%, statistically zero, as required.
Geometry discipline, worth keeping: an intermediate specification using program-centroid rather than per-generator geometry produced a +12% artifact on unseeded events. Several Utah generator networks form north–south lines exceeding 100 km, which a centroid represents poorly. The placebo is what caught it — every design on this site gets one.
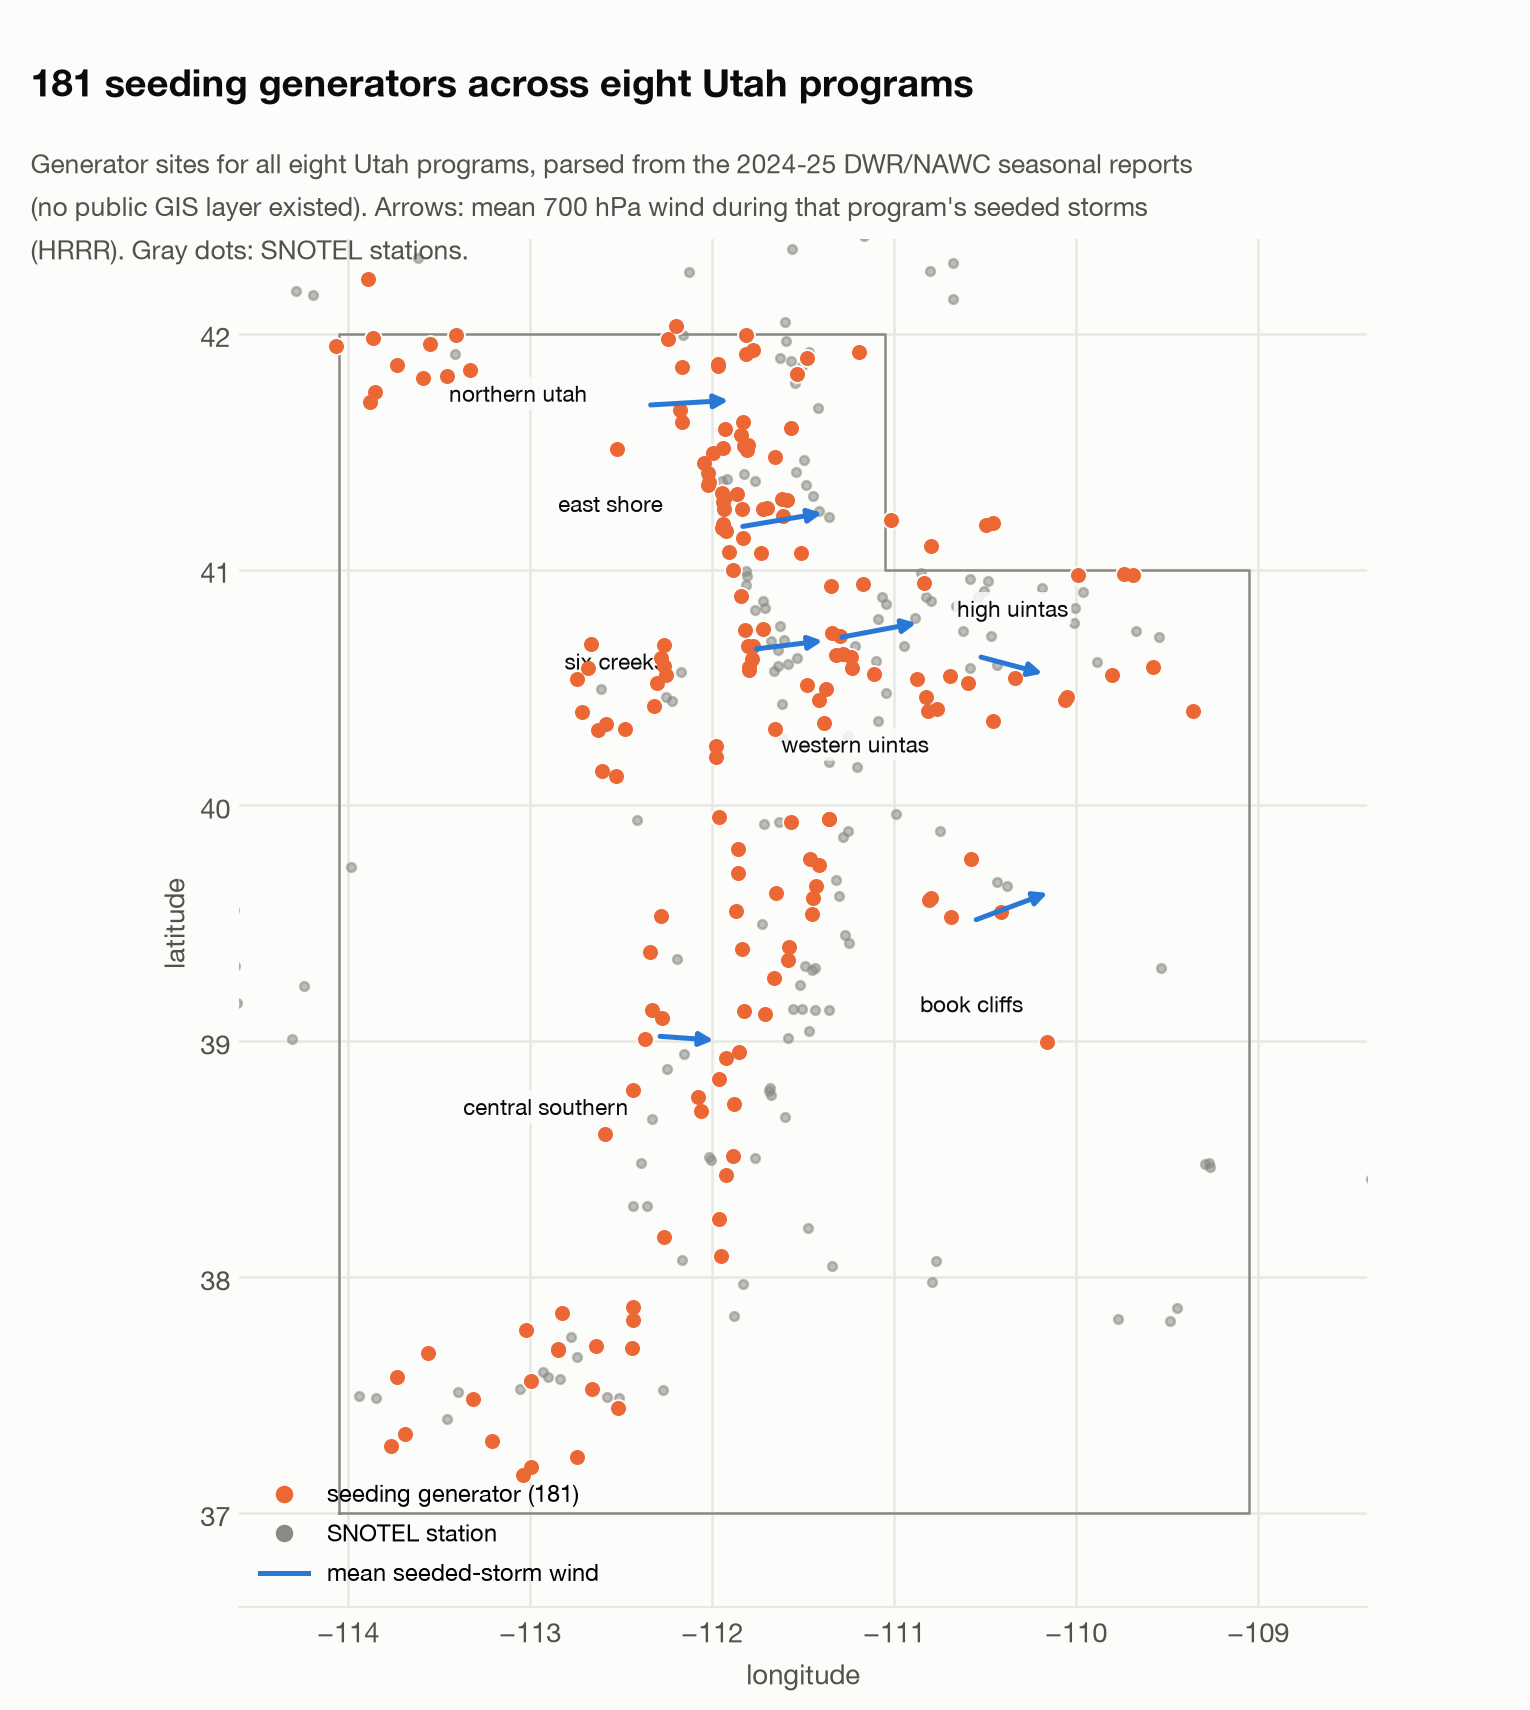
The map itself is a first: no public GIS layer of Utah's generator network existed. These 181 sites were parsed from the eight 2024–25 DWR/NAWC seasonal report PDFs (Book Cliffs sites are town-approximate), with the report text preserved for provenance. Mirrored on this site's atlas: /data/atlas/generators-ut-2024-25.csv.
Finding two: 46 winters cannot see the claimed effect
THE SEASONAL NOISE FLOORThe storm designs have a seasonal companion: a staggered-adoption panel over 476 SNOTEL stations in seven states, 46 winters (1981–2026), with station and winter fixed effects fit on untreated observations (the Borusyak–Jaravel–Spiess imputation estimator) and Utah's per-area adoption history — start years, the 1983–87 suspension, the gaps — reconstructed from the program record RECORD. The overall effect on Nov–Mar precipitation: −1.4%, 95% CI [−6.0, +3.6] MEASURED. The pre-adoption placebo comes in at +5.6%, so the design's noise floor is about ±6% — wider than the lower half of the claimed 3–15% range.
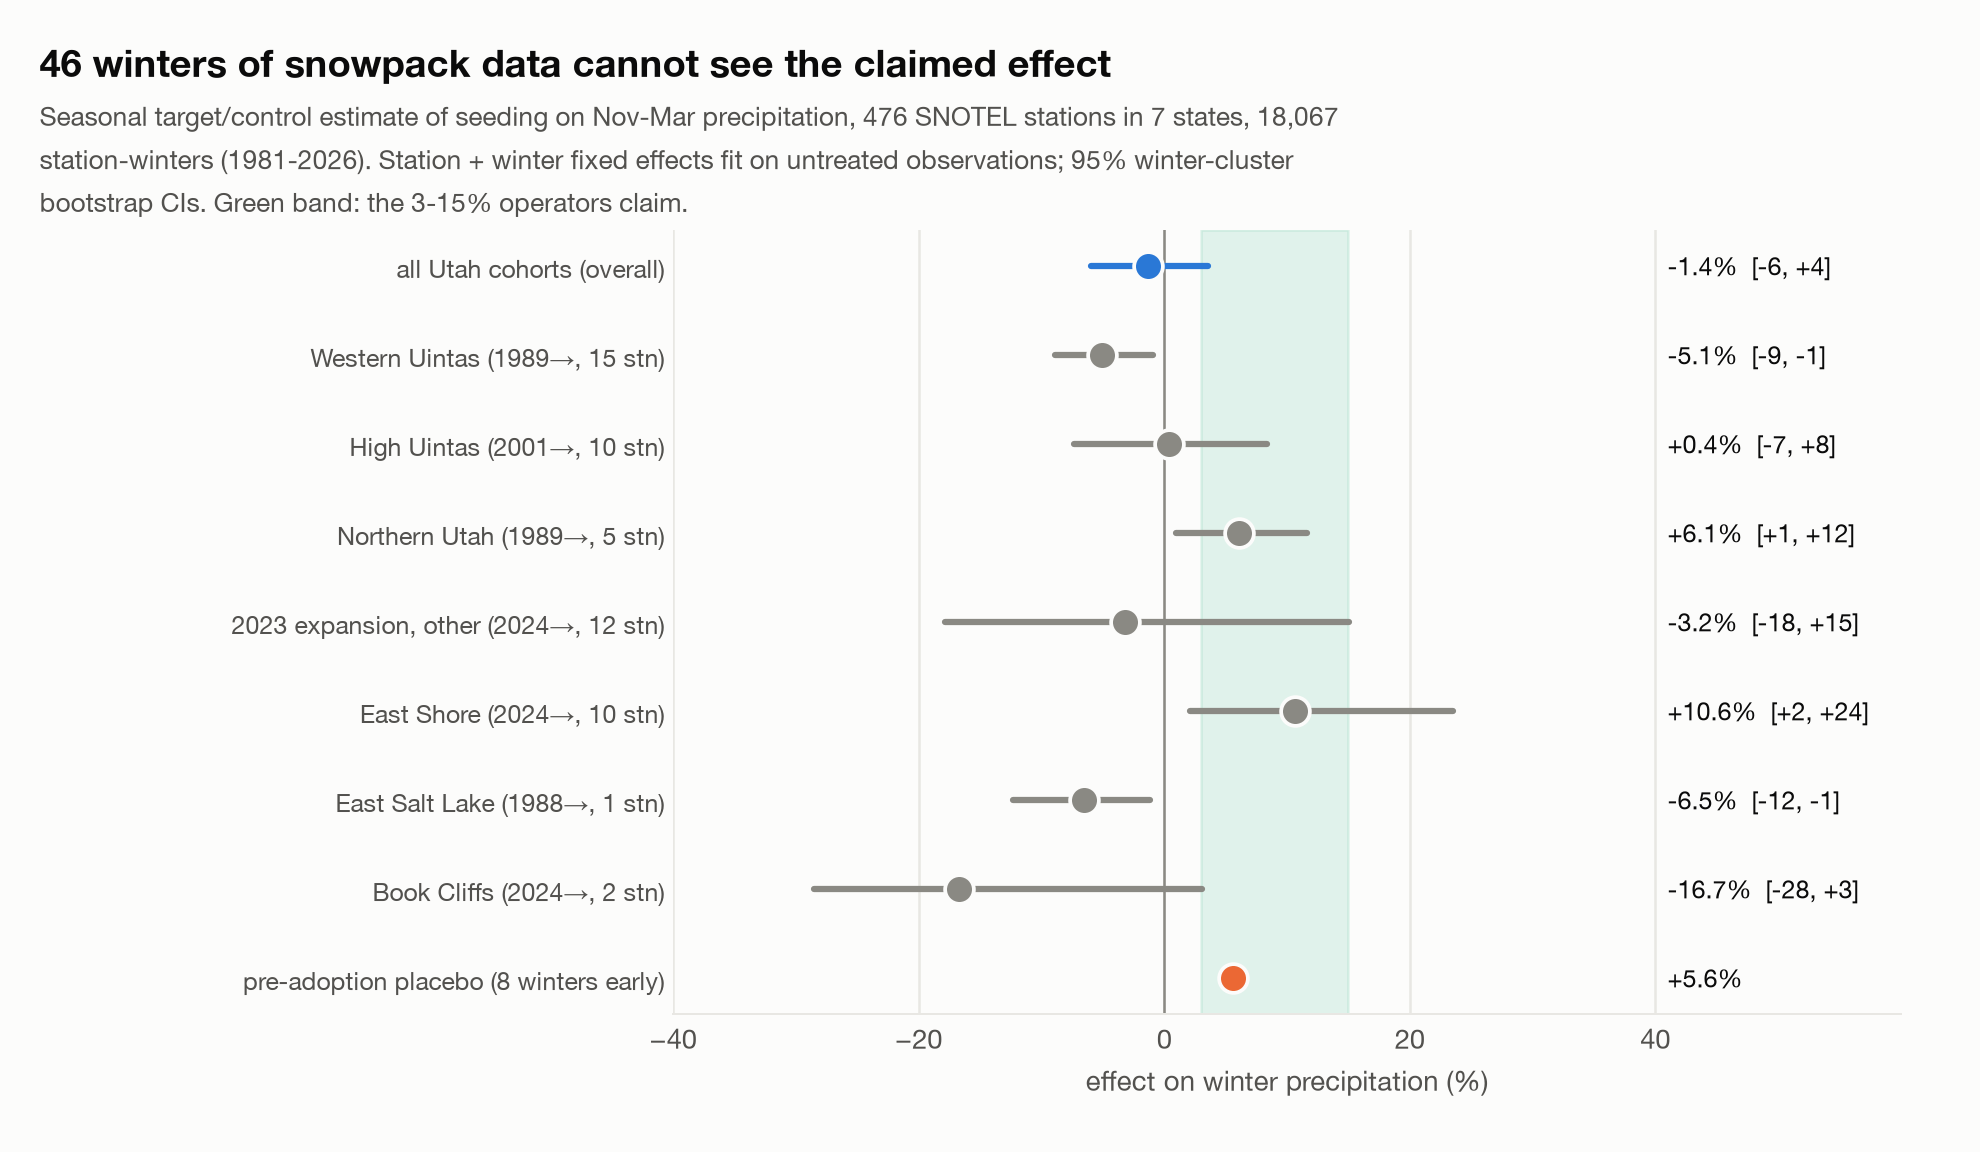
Read carefully, this is not "seeding does nothing." It is something more useful: seasonal gauge statistics, done as carefully as the data allow, cannot resolve an effect of the claimed size either way. Any published seasonal target/control evaluation reporting a significant 5–20% increase from comparable station data should be read against that ±6% noise floor — and against Design 1's +335%, which shows what the selection channel alone can manufacture.
Verification pass: we recomputed it
SEPTEMBER 22, 2026 · INDEPENDENT ESTIMATOR, RELEASED DATAThis site does not quote numbers it has not checked. From the study's released per-event panel (mirrored: ut2425-storm-per-event.csv, 121 events), we recomputed the Design 2 estimates with our own estimator, written blind to the original implementation — per-event log ratio of exposed to near-miss-control mean precipitation, seeded-minus-unseeded difference of means. Every per-program effect reproduced to rounding MEASURED:
| Program | Our recomputation | Study's released value |
|---|---|---|
| Central/Southern + Tooele | +36.0% | +35.8% |
| High Uintas | +31.8% | +31.8% |
| Northern Utah | +8.3% | +8.2% |
| Western Uintas | +64.4% | +64.6% |
| Pooled | +17.1% [+2.4, +32.9] (event-weighted, program FE) | +24.2% [+3.7, +49.7] (the study's weighting) |
The pooled numbers differ only in how programs are weighted — both are directionally positive with lower bounds a hair above zero, and both sit well above what the physics permits, which is the study's point about residual selection in Design 2. Recomputation script published: ingest/verify_case002.py.
Design 3 got the stronger treatment: a blind reconstruction sharing nothing with the study's implementation but the released event windows, winds and generator coordinates. Our own pull of 141 Utah SNOTEL stations from the public AWDB API, our own storm totals, our own plume geometry (5–45 km, ±40°), our own two-way fixed-effects estimator and event bootstrap — 6,802 station-event observations. Result: in-plume × seeded +4.2% [−4.6, +14.4] against the study's +1.5% [−9.6, +13.1], and the must-be-zero placebo at −3.1% [−21.7, +12.4] against its −8.4% [−26.8, +10.3] MEASURED. Two independent implementations, two spec vocabularies, one conclusion: a small positive point estimate the season cannot distinguish from zero, and a placebo that behaves. Exact agreement is not expected from an independent spec — and would be suspicious.
Reconstruction script published: ingest/verify_design3.py. The seasonal panel and Design 1 remain rerun-only checks; the panel's full SNOTEL archive rebuild is the roadmap's next verification item.
What this case calibrates
1. A target/control number without an exogeneity argument is a claim, not a measurement. The +335% is now this site's reference for how large pure operator selection can run at storm scale; any operational evaluation that does not address it inherits it. 2. The placebo test is the statistical persistence test. Case 001 demanded that a radar line be absent before seeding; this case demands that a statistical design return zero where no silver iodide flew. Two of the three designs pass; the one programs actually use was never asked. 3. The binding constraint is seasons, not stations. One season of wind-rotation analysis brackets the per-storm effect at [−9.6, +13.1]; four to nine seasons would resolve it. The Utah Division of Water Resources holds decades of operations reports and provides them on request — the path to the answer runs through the Records, which is this site's beat. And the selection mechanism itself is now independently corroborated: Case 003 audits all 203 of these seeded storms against the HRRR archive and finds the operators really do pick the seedable ones.
Honest limits, stated as the author states them: one season for the storm designs; storm-mean 700 hPa winds, not hourly; SNOTEL undercatch attenuates but does not bias under fixed effects; seeded/unseeded labels inherit any errors in the operators' storm tables; the seasonal treatment map is county-level, diluting a true effect toward zero — which is exactly why the storm-level designs exist.
Source and credit: Bryce Judy, "Storm-Level Independent Verification of Operational Cloud Seeding: Evidence from Utah's 2024–25 Winter Season," working paper v1.1 (first version July 20, 2026; this version September 21, 2026) — code, data and paper, MIT-licensed, fully reproducible with uv on a laptop. Constructed datasets mirrored here with attribution: generators-ut-2024-25.csv (181 sites, 8 programs) and ut-seeding-treatment.json (per-area seeding timeline 1974–2026). Estimates quoted from the released results JSONs (data/results/ in the repo), re-checked against the paper. Physical bounds from French et al. 2018 and Friedrich et al. 2020 (PNAS, SNOWIE); see the Science for where these numbers sit on the honest ladder.