Could seeding work right now?
HRRR · WESTERN UNITED STATES · HOURLYMODELED · HRRR supercooled liquid water path: cloud liquid integrated over the 500–900 mb layers where the air is below freezing, classified by the operational criteria — measurable SLWP ≥ 0.05 mm, liquid-weighted temperature in the AgI window (−8 to −25 °C), column not already ice-dominant. Rings are the active winter programs; the caption reports whether any of them sit in seedable conditions each hour. Synoptic cycles run to +36 h. A quiet map in the warm season is the product working, not failing.
Most arguments about cloud seeding skip the only question that comes first: was there anything to seed? Glaciogenic seeding requires three things at once — supercooled liquid water, a cloud in the silver-iodide activation window of roughly −8 to −25 °C, and flow that carries the plume through the cloud and over the target. On most days, over most terrain, at least one of the three is missing. Every one of them is a field in operational weather models, which means seedability is a forecast — and nobody publishes one. This page will.
The recipe is the one the research literature formalized (Tessendorf et al. 2021, who found seedable conditions in only 20–30% of cold-season hours even over the best interior-West ranges MODELED): cloud liquid water present at sub-freezing temperatures, temperature in the activation window, cross-barrier flow able to deliver the plume. The same criteria operators themselves use for go/no-go — Wyoming's 700 mb at −8 °C with radiometer-confirmed liquid, Nevada's crest-level −5 °C — turned into a public, hourly map.
What the map will show
| Layer | From | Meaning |
|---|---|---|
| Seedable water | HRRR CLMR·T<0°C, 500–900 mb | Supercooled liquid water path, integrated layer by layer — the raw material. Without it, seeding is burning silver into clear air. |
| Activation window | liquid-weighted T of those layers | Is the liquid itself where AgI actually nucleates (−8 to −25 °C)? Warmer, nothing freezes; colder, nature needs no help. |
| Glaciation state | HRRR TCOLI vs TCOLW | A cloud already full of ice is already efficient — not a target. |
| Plume transport | 700/850 mb wind vs terrain | Cross-barrier component and blocking: can a ground plume even reach the cloud over the crest? |
| The verdict | all of the above | A single seedability index over western-US terrain, hourly, out through the HRRR forecast range — with the program target areas from the Atlas drawn on top. |
Data honesty, stated up front: model supercooled liquid is the weakest of these fields — HRRR is known to under-produce shallow orographic liquid in some regimes, and the proper version of this index integrates liquid layer by layer from the pressure-level files rather than trusting a column total. Both versions will be published, labeled MODELED, and verified against icing pilot reports and radiometer studies where they exist. Aviation icing guidance (FIP severity) is the closest existing cousin of this product; the difference is that this one is drawn for mountains and watersheds, not airways.
Two companions follow the live map. A seedability climatology — how many hours per winter is each range actually seedable, built from the archived HRRR record — which is the number every feasibility debate needs and no one quotes. And the hindcast record: when a seeding claim or controversy arises, the first exhibit in any forensic analysis is this map for that hour, answering whether the atmosphere offered anything to seed at all.
The climatology — how often is seeding even possible?
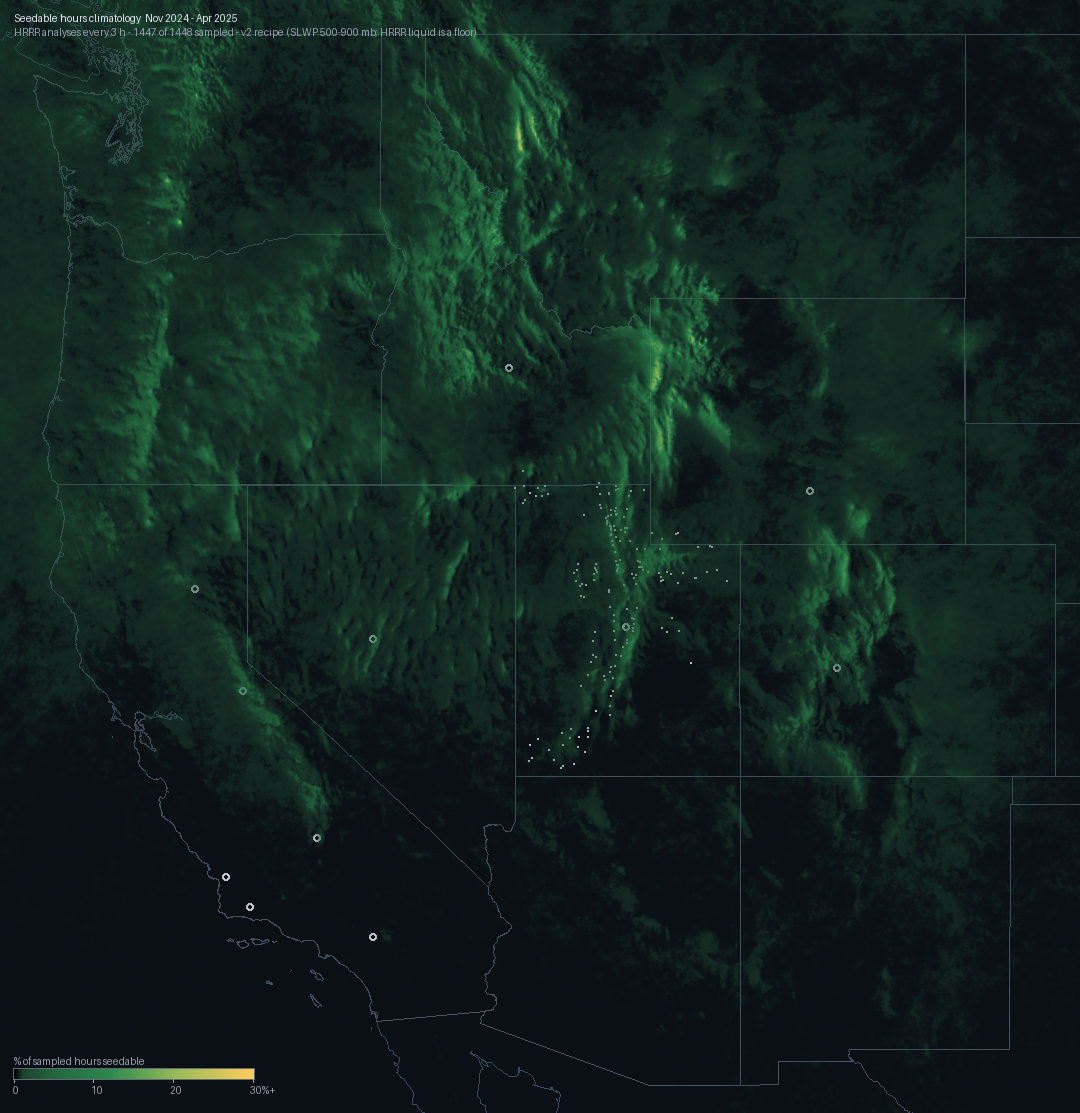
FULL SEASON 2024–25 · PILOT JANUARY 2026Every feasibility debate needs one number nobody quotes: the fraction of hours seeding conditions actually exist over a given range. The research benchmark (Tessendorf et al. 2021) put it at 20–30% of cold-season hours over the best interior-West terrain. This site computes it directly from archived HRRR analyses with the live map's own v2 recipe. Here is the first full season — November 2024 through April 2025, 1,447 of 1,448 three-hourly analyses, one missing hour all winter MODELED — the same season audited storm by storm in Forensic Case 003:
| Program | At the centroid | ~51 km box mean | Best terrain within 60 km |
|---|---|---|---|
| Utah statewide | 3.5% | 4.1% | 12.7% |
| PG&E Mokelumne | 5.5% | 3.6% | 8.1% |
| Colorado CWCB areas | 1.6% | 3.2% | 10.9% |
| Nevada DRI ranges | 2.6% | 2.5% | 7.0% |
| Idaho Collaborative | 0.8% | 2.0% | 11.5% |
| PG&E Lake Almanor | 2.1% | 2.0% | 7.3% |
| Wyoming WWDO | 1.5% | 1.2% | 3.6% |
| Kern River | 0.8% | 0.9% | 6.5% |
| Santa Barbara / Lopez / Santa Ana | ≤0.1% | ≤0.3% | ≤1.9% |
Three things worth saying plainly. First, Utah's target areas were the most seedable of any U.S. program in 2024–25 — the network is well-placed, and at the 181 actual generator sites the seedable share ran 0.8–4.9% by program (2.6% site-weighted), peaking at Six Creeks and East Shore on the Wasatch. Second, the seasonal cycle matters: Utah's target areas ran 3.7% in November, peaked at 6.2–6.3% in February–March, and fell to 1.2% by April — the seedable winter is really a December–March winter. Third, even the best terrain anywhere ran ~13% of hours, and program areas 1–4%: these v2 floors sit well under the 20–30% research benchmark, and that gap — HRRR's under-produced shallow liquid versus genuinely thin opportunity — is exactly what the roadmap's radiometer-vs-model comparison is for. Either way, the arithmetic of the Science tightens: a percent-level slice of hours is the pool a seasonal effect has to come from.
Season data: season-2024-25.json (per-month and per-program numbers, including the generator-site baselines) · season-2024-25.npz (the count grid) · monthly grids under /data/climatology/2024-25/. Built by ingest/climatology.py + climatology_season.py from the same classifier as the live map, so the climatology cannot drift from the product it contextualizes.
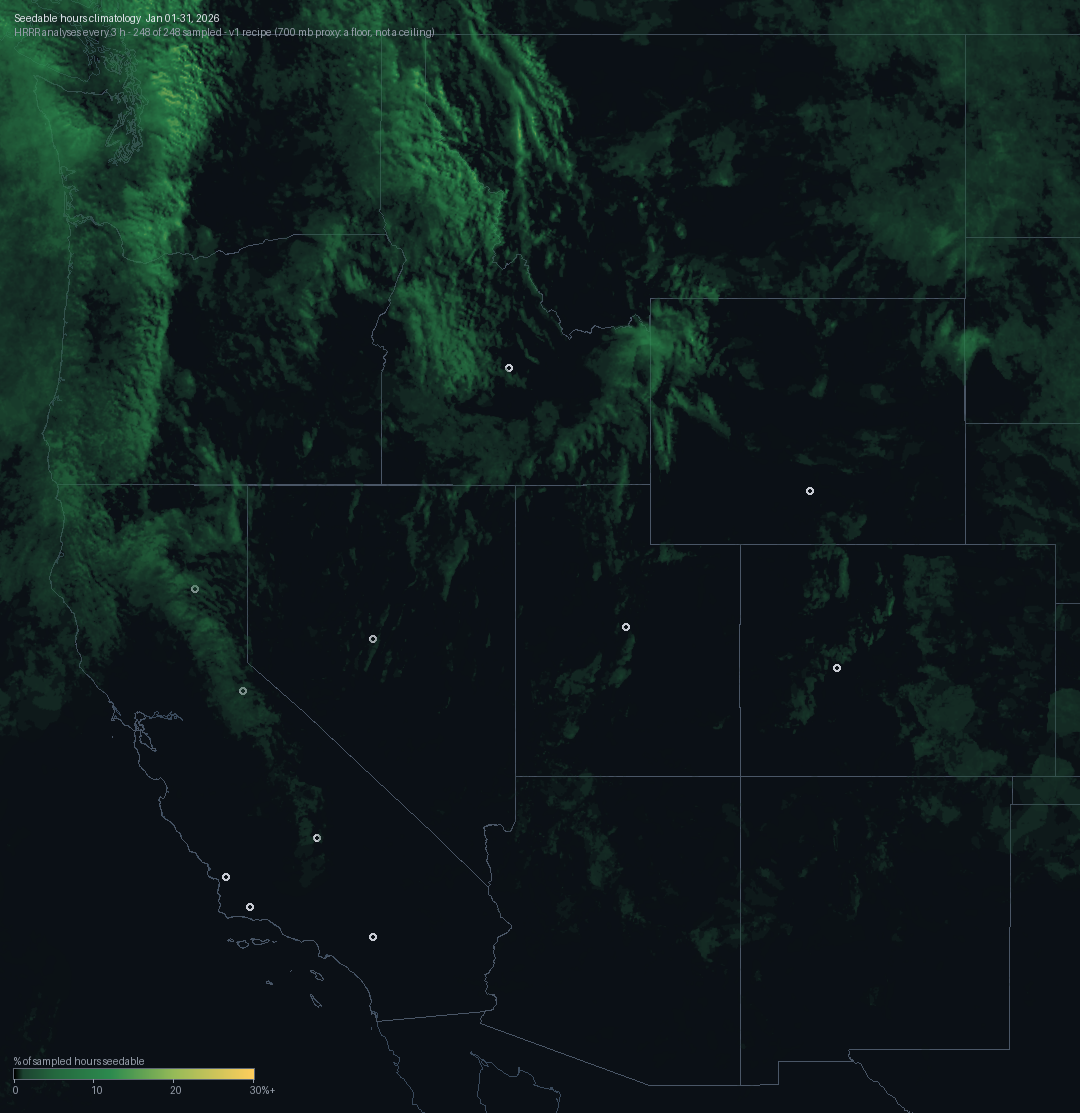
The January 2026 pilot below — a different winter, and a far worse one — remains published as the first run and as a cautionary contrast: Utah's box mean was 2.3% in January 2025 but 0.3% in January 2026. One month is never a climatology; one season is only the start of one MODELED:
| Program | At the centroid | ~51 km box mean | Best terrain within 60 km |
|---|---|---|---|
| Idaho Collaborative | 0.0% | 0.7% | 8.1% |
| PG&E Lake Almanor | 2.4% | 2.5% | 6.5% |
| Utah statewide | 0.0% | 0.3% | 3.6% |
| Colorado CWCB areas | 0.0% | 0.5% | 3.6% |
| PG&E Mokelumne | 1.6% | 1.7% | 3.6% |
| Nevada DRI ranges | 0.4% | 0.4% | 2.4% |
| Kern River | 0.0% | 0.5% | 2.0% |
| Wyoming WWDO | 0.0% | 0.1% | 1.2% |
| Santa Barbara / Lopez / Santa Ana | 0.0% | 0.0% | ≤0.4% |
Read it honestly, because it says two loud things. First, the geography is textbook: the seedable hours paint the terrain — the Cascades, the Blues and Wallowas, the Idaho and Montana ranges, the Sierra crest — and the deserts stay dark. Second, January 2026 was a bad month to be a cloud seeder in the interior West: single digits at best over the ranges, far below the 20–30% climatological band, in the winter Nevada logged a record-low snowpack. The storm track lived north; Utah, Colorado and Nevada had storms to seed only a few percent of the time. That is the whole point of measuring — "we could have seeded" and "there was anything to seed" are different claims.
Caveats that ship with the number: one month is not a climatology (the 2024–25 season above is the first full one); this pilot used the column-proxy recipe — the season run and the live map use the layer-integrated SLWP; HRRR under-produces shallow orographic liquid, so these are floors; and program centroids sit in valleys — Idaho reads 0.0% at its centroid while the Sawtooths 60 km away read 8.1%, which is why the table's last column is the honest one. Grid data: pilot-202601.npz.
Status
Live, v2. The loop updates every HRRR cycle — hourly to +18 h, +36 h on the synoptic cycles — on the layer-integrated supercooled liquid water path, with the active winter programs from the Atlas ringed in silver and named in the caption whenever one sits in seedable conditions. Inside Utah's ring, the fine silver points are the state's 181 actual ground generator sites (the atlas's deep layer, from Case 002) — so the map answers not just "is it seedable where a program operates" but "is it seedable where the silver iodide actually comes from." The same classifier, run backward over the HRRR archive, audited a full season of Utah's seeding decisions in Case 003 and built the 2024–25 season climatology below. Next in line: more seasons (the machinery now does one per ~3 hours of archive pulls), and the hindcast index so any past hour can be pulled up on demand.